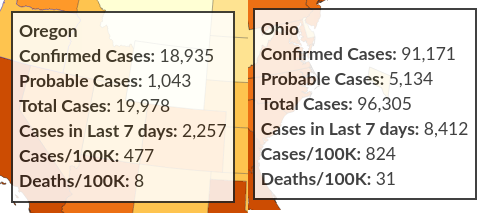
A friend of mine from Ohio asked “What are infection rates like in Oregon these days?” And immediately I thought of “What’s it like in Ohio?” I could say it was OK here. But is it? And how much better or worse is it? I DuckDuckGo‘d it to see what I could find out. Their response at the top of the list was CDC. And they had it.
(Images were joined together for this post.)
Looking at the last two lines, Cases and Deaths / 100k, we see that it is almost twice as high in people with Covid. And their death rate is almost four times higher. Ouch. No wonder he went on to write “‘m fairly disappointed that there’s so many people who, for whatever reasons, are not acting in the best interests of public health and safety.” Boy oh boy, I can only hope for him.
If you’d like to compare the states in US, visit this CDC site. You’ll have a map like this one.
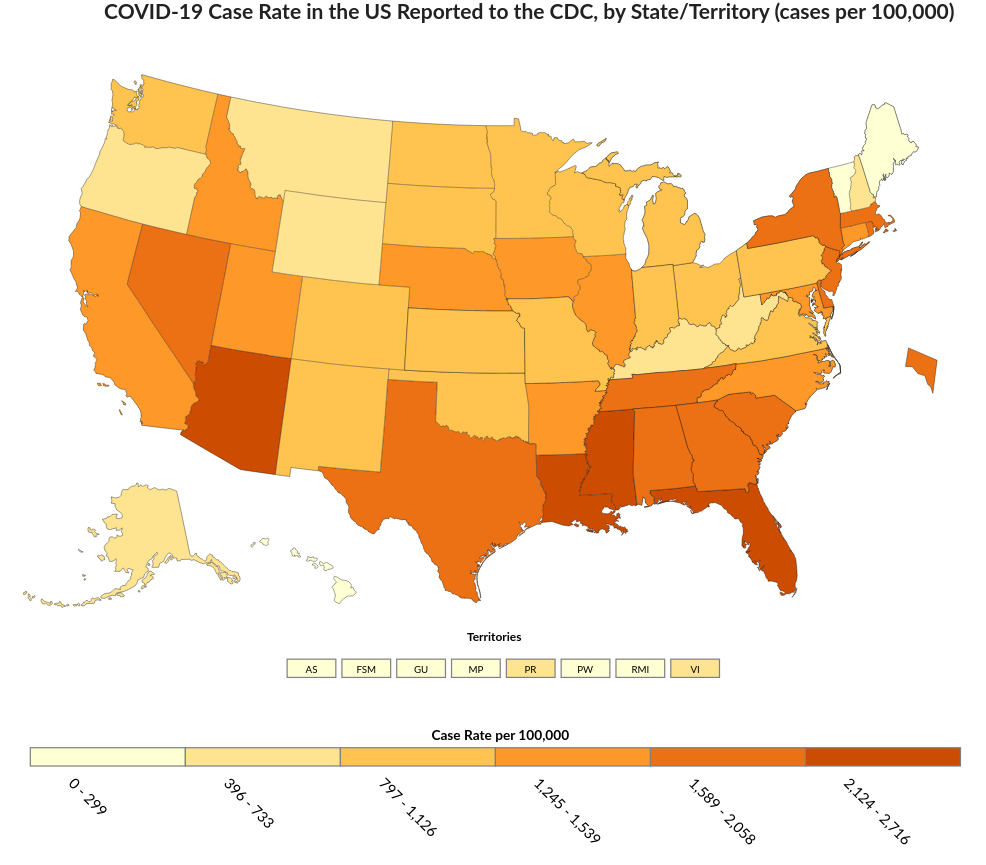
You can compare Total Cases, Cases in Last 7 Days, Cases per 100,000, Total Deaths, or Death per 100,000. Move your mouse over the map to check on different states. You’ll get something like what I used in the beginning.
As a last word: Wear A Mask. It really isn’t that hard. Make more states like Maine or Vermont and less like Arizona or Mississippi.